PVsyst Simulation: The Complete Guide for Solar Engineers (2025)
Imagine committing ₹50 crore to a solar power plant — and only discovering three years later that it’s producing 12% less energy than expected. This isn’t a hypothetical. It’s a scenario that plays out repeatedly when solar developers skip rigorous PVsyst simulation or rely on poorly executed energy yield analysis.
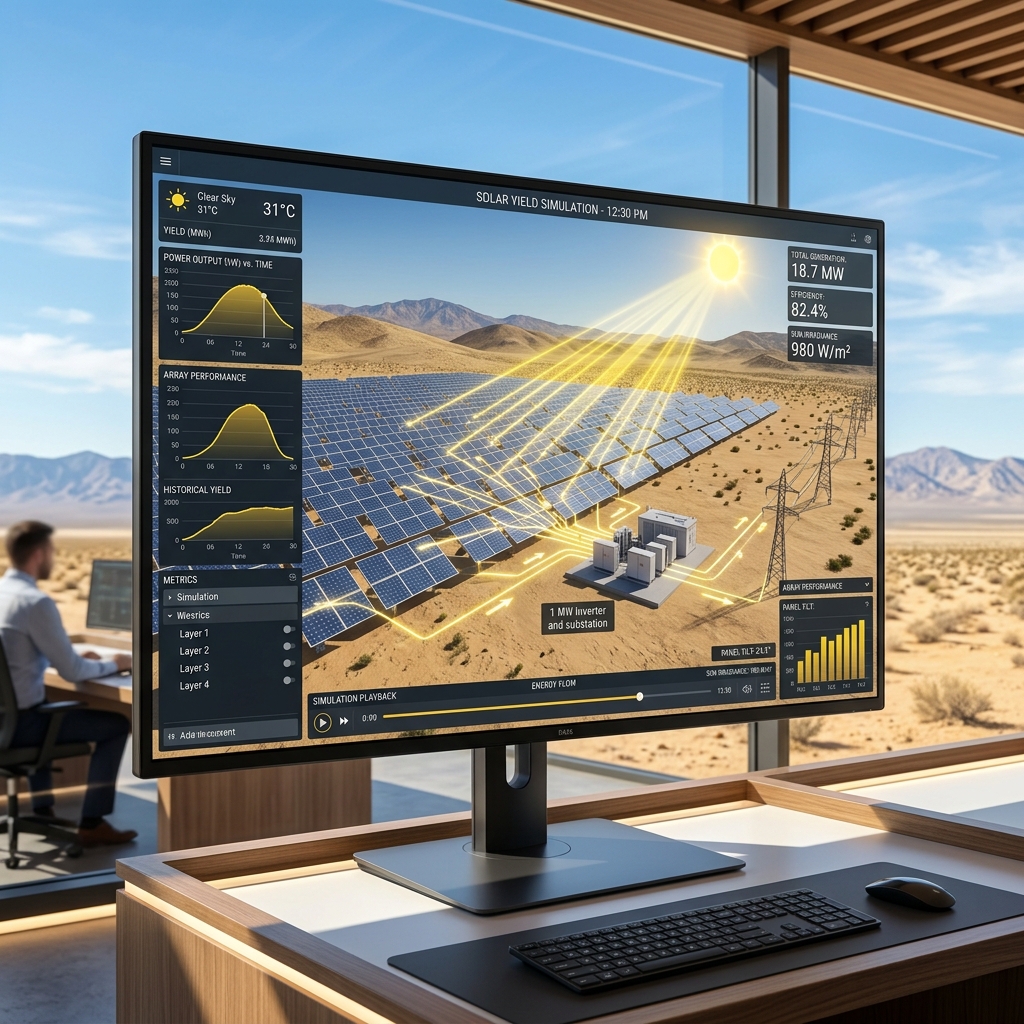
PVsyst simulation is the engineering process that predicts — with bankable accuracy — how much electricity your solar plant will generate before a single panel is installed. It is the single most important technical document in any solar project: used to negotiate PPAs, secure debt financing, set performance guarantees, and underpin 25-year revenue models. If you’re a solar engineer, developer, lender, or O&M manager, understanding PVsyst is not optional.
This guide covers everything — how PVsyst works step by step, how to calculate and interpret Performance Ratio and CUF, what P50 and P90 mean, how to model solar plant degradation, and what makes a PVsyst report truly bankable.
What Is PVsyst?
PVsyst is a specialised software package for the design, simulation, and analysis of photovoltaic (PV) solar energy systems. It models how a solar plant will perform under real-world conditions — accounting for irradiance, temperature, shading, equipment losses, and degradation — to produce an energy yield prediction expressed in annual kWh.
Originally developed at the University of Geneva and continuously updated since 1994, PVsyst is the de facto industry standard for solar energy simulation worldwide. It is:
- Required by virtually all lenders and development finance institutions (IREDA, PFC, SBI, ADB, IFC) for project financing
- Used by EPCs, independent engineers, and Owner’s Engineers for design validation
- Accepted by MNRE and state DISCOMs as the standard simulation tool for grid-connected solar in India
- Capable of modelling systems from 1 kWp rooftop to 500 MWp utility scale solar parks
PVsyst vs Other Solar Simulation Tools
| Tool | Best For | Key Strengths | Key Limitations |
|---|---|---|---|
| PVsyst | Detailed engineering & bankable reports | Most accurate loss modelling; industry-standard; lender-accepted | Paid license; learning curve for advanced features |
| HelioScope | Layout optimisation | Fast; cloud-based; good 3D visualization | Less granular loss analysis than PVsyst |
| SAM (NREL) | Policy & financial analysis | Free; open-source; good for sensitivity analysis | Less adopted by engineering teams for final design |
| Aurora Solar | Rooftop & C&I sales | Sales-focused; fast shading analysis | Not suitable for utility-scale detailed engineering |
For utility scale solar PV design, PVsyst is the only tool whose output is universally accepted by lenders, insurers, and independent engineers. When a project’s financial close depends on a bankable energy yield report, PVsyst is non-negotiable.
How PVsyst Simulation Works: A Step-by-Step Breakdown
Step 1: Meteorological Data Input
The quality of a PVsyst simulation is only as good as the weather data feeding it. Engineers input a Typical Meteorological Year (TMY) dataset containing:
- Global Horizontal Irradiance (GHI) — total solar radiation on a horizontal surface
- Diffuse Horizontal Irradiance (DHI) — scattered sky radiation component
- Ambient temperature — affects module operating temperature and efficiency
- Wind speed — used for module temperature modelling
India-specific note:
India’s irradiance varies dramatically by region — from 4.5 kWh/m²/day in Assam to over 6.5 kWh/m²/day in Rajasthan. Using generic national averages instead of site-specific data introduces systematic errors of 5–15% in energy yield predictions.
Step 2: System Configuration
The engineer inputs the full system architecture: Module selection (manufacturer, model, power rating), Inverter selection and sizing (DC:AC ratio typically 1.1–1.3), String configuration, and Transformer parameters.
Step 3: Shading & Horizon Analysis
PVsyst models two types of shading: Near shading (3D modelling of adjacent objects and inter-row shading) and Far horizon shading (hills, ridgelines). Inter-row shading is a significant source of loss in utility-scale plants, typically 1–4%.
Step 4: Loss Modelling — The Loss Waterfall
The loss waterfall diagram is PVsyst’s signature output — it shows how the theoretical maximum energy yield is progressively reduced by each loss factor.
| Loss Factor | Typical Range (India) | Description |
|---|---|---|
| Irradiance losses | 2–3% | Reflection losses as sun angle changes |
| Module temperature losses | 5–8% | Power drops ~0.4%/°C above 25°C (critical in India) |
| Inter-row shading | 1–4% | Shadow from adjacent rows |
| Soiling losses | 2–6% | Dust, bird droppings, pollen |
| DC wiring losses | 0.5–2% | Resistive losses in DC cables |
| Inverter losses | 2–4% | Conversion inefficiency |
Key PVsyst Simulation Outputs: Performance Ratio, CUF & More
Solar Performance Ratio Calculation
The Performance Ratio (PR) is the most widely used metric for assessing solar plant performance quality. It measures how efficiently the plant converts available solar irradiance into usable electricity.
PR (%) = Annual Energy Output (kWh) / [Installed Capacity (kWp) × Annual GHI (kWh/m²)]
CUF Calculation for Solar Power Plants
The Capacity Utilisation Factor (CUF) measures how much of the plant’s theoretical maximum energy it actually produces annually.
CUF (%) = Annual Energy Generated (kWh) / [Installed Capacity (kW) × 8,760 hours] × 100
P50 and P90 Energy Estimates
- P50 (50% probability): Median year estimate, used by developers for planning.
- P90 (90% probability): Conservative estimate, used by lenders for debt sizing.
Modelling Solar Plant Degradation Analysis in PVsyst
Solar modules don’t maintain peak performance forever. Solar plant degradation analysis models how module output declines over the 25-year project life:
- Year 1: Light-Induced Degradation (LID) — typically 1.5–3% drop.
- Years 2–25: Linear degradation — typically 0.5–0.7% per year.
- Total at Year 25: Approximately 15–18% from initial rated output.
V-TECH RENEWABLES: Our Approach
At V-TECH RENEWABLES, PVsyst simulation is embedded in every project we undertake. Since 2009, we have used PVsyst as our primary energy simulation tool for projects ranging from 1 MW rooftop systems to 70 MWp ground-mount installations.
About the Author
This article was written by the Engineering Team at V-TECH RENEWABLES, a leading solar design and renewable energy consulting firm based in Pune, India. With 15+ years of experience delivering PVsyst simulation reports for projects from 1 MW to 70 MWp, V-TECH RENEWABLES is India’s trusted solar engineering partner.